Felix, qui potuit rerum cognoscere causas. (Virgil)
Contents
With regard to solutions for the climate-energy-wealth conundrum a nihilistic perspective is sketched for our civilization. If not prematurely extinct after nuclear warfare, humans' mental and cognitive capabilities − already nowadays at an advanced stage of decadence in Western societies − are going to experience distinctive degeneration from accumulated microplastic particles in brain tissue.
Having a background in natural science the author fully agrees with the American biochemist Isaac Asimov:
"It is not so much that I have confidence in scientists being right, but that I have so much in nonscientists being wrong."
Be Aware of Science!
As the fog cleared, rational thinking slowly found its way back to hearing and since my life and that of my family had begun anew in the less paranoid Polish society, my thoughts wandered back to the slogan "follow the science", this time climate research. In the meantime, climate change, global warming and climate neutrality had become omnipresent buzzwords. Far-reaching laws and initiatives were prepared at all political, social and entrepreneurial levels to reduce CO2 emissions. States have been encouraged or condemned by courts to define specific objectives and measures. Referring to article 20a of the German Basic Law climate protection was made mandatory by the Federal Constitutional Court. However, climate and the composition of Earth's atmosphere are global phenomena. Even almost zero emissions of Europe's largest economy, which were "mandated" for the near future, would barely impact the atmospheric composition. However, the measures taken and to be expanded have already massively changed the German economic situation. Industrial production is no longer competitive due to rising energy prices and it's increasingly relocated to other regions of the world. Deindustrialization and impoverishment are becoming more tangible as a perspective. Against this background the question arises as to the usefulness of such policies and whether the scientific basis for them is really sound. The memory of the belief in science during the Corona period and the fact that climate is more complex than "Corona" prompted me to look deeper into the topic.
In a nutshell, my conclusion was: there is no reason to panic but to adapt to climate change (btw a pleonasm) which is real and to a large extent anthropogenic. Although temperatures have risen globally for the first time in the Common Era [1] there will be regional changes to the worse here as well as to the better elsewhere. There is no reason to expect a runaway scenario prophesied by apocalyptics like the "last generation".
[1] R. Neukom et al., Nature 571 (2019) 550 No evidence for globally coherent warm and cold periods over the preindustrial Common Era
In spring 2025 I created a summary of my previously condensed view of the topic in the form of a presentation for the Rotary Club Goethe in Warsaw (I wasn't aware that there has been a row of Warsaw Climate Talks since COP19 was held in the Polish capital). The slides are animated in a 16 min movie:
"There are things that are so wrong that not even the opposite is true."
However, most people are sticking to the summary and the conclusion written down in such articles. This may be problematic as outlined in the following simple example.
On the occasion of a short dispute in the comment column for an article in the NZZ, a scientific article was mentioned to me. It supposedly should call into question the "saturation" phenomenon of atmospheric CO2. This expression denotes the observation that the energy that is radiated by Earth into space and which can be absorbed through the excitation of CO2 vibrations is already to a large extent absorbed by the current level of 400 ppm atmospheric CO2. It's therefore argued by numerous scientists (and climate deniers) that a multiple of that CO2 concentration won't significantly increase today's green house effect. Indeed, the authors of that article negated the saturation effect in their concluding statement: "We conclude that as the concentration of CO2 in the Earth's atmosphere continues to rise there will be no saturation in its absorption of radiation and therefore there can be no complacency with its potential to further warm the climate." This activistic statement is problematic in two ways.
First, it's the expression “there will be no saturation” which is deliberately used here - not in a discussion on social media but in a scientific article. However, this concluding remark is highlighting a self-evident fact because of the underlying physics. The fraction of non-absorbed radiation follows an exponential function (Lambert-Beer law). With increasing path length (here: altitude in the atmosphere), concentration of the absorbant (here: CO2) and absorption coefficient of the latter (kind of probability of the absorption, function of the wavelength) the initial intensity decays more rapidly and the non-absorbed fraction approximates zero. However, excited CO2 molecules that are vibrating in a higher quantum state after radiation with the suitable wavelength was absorbed are also reemitting that radiation when they are "falling" back to the lower quantum level. Consequently, the energy of the initial radiation doesn't disappear from the atmosphere at the speed of light but via countless absorption-emission steps and thermal equilibrium settings (nota bene: the atmosphere Is an open system and the laws of equilibrium thermodynamics do not strictly apply here). No natural scientist would therefore assume saturation in its stringent meaning. The authors might have speculated that their expression will be interpreted by an ingenuous reader in the sense outlined above: that the article’s results are debunking the exponential approximation of the IR-absorption / CO2 concentration curve or the resulting logarithmic approximation for the radiative forcing (no drastic T-increase with further CO2 emissions), respectively.
Secondly, the authors are playing with the reader's common sense by using the formulation "… as the concentration of CO2 … continues to rise …". This suggests doubled, tripled or quadrupled amounts of CO2, a range that is covered in figure "a" where the radiative forcing follows logarithmic curves. This contrasts the essential message from the authors that there is no saturation but a potential for further warming. Indeed, this warming potential can only be seen at twentyfold and higher levels of the current CO2 concentration as shown in figure "b" (nota bene: logarithmic x-axis). Such a huge offset in CO2 concentrations - relevant versus accentuated range - is by no means reflected in the authors' statement "… continues to rise …".

GROK animated "The Hunters in the Snow", painted by Pieter Bruegel the Elder in the Little Ice Age (1565), (un)hover mouse
Beware of $CI€NC€!
Indeed, such a bias in research became visible in a PIK led report for the Network for Greening the Financial System (NGFS) on climate risks (Kotz et al., Nature 628, 551 (2024) The economic commitment of climate change). The authors were accused of “systematically exaggerating” economic damages from climate change, using “scientifically invalid” methods. The article eventually was retracted on 3rd December 2025. The authors of the study had prophesied a climate induced economic damage of $38 trillion until 2049 (median from a $19 to $59 trillion range) corresponding to a 19% global loss of income. However, applying a "leave-one-out" test in the statistics by independent researcher revealed that these drastic global numbers nearly disappeared without using the dataset from Uzbekistan in the simulation. The underlying economic problems in Uzbekistan in the nineties (the data used in the model) correlated with local climate anomalies but were in first instance caused by regional projects, e.g. soviet interventions in the water balance around lake Aral (which already disappeared around 1200 due to tectonics) and the collapse of the USSR. Instead they had a drastic impact on the simulation result. If the latter strongly depends on the economics of a small country it seems questionable whether the model is appropriate for the posed problem.
It's a good sign that there is insight and willingness in the scientific community to correct published results. This example is not an isolated case, but with regard to the journal's impact and reputation and not least the politically charged topic it took too much time for the withdrawal. In the meantime, the content of the article was used by the World Bank, the OECD and other institutions in the financial world to calculate the economic effects of climate. Not to be counted are the presumably numerous reports in uncritical media, which, with reference to the study, have solidified the image of a devastating climate in people's minds. How many of them will report on the withdrawel of the article, as the NZZ did on the same day of its retraction? Cynically, one could say that the PIK has successfully delivered what was expected by politicians and profiteers of EU's green deal.
In order to classify the statements of $CI€NC€, one must decipher them using the language of business. The Rosetta Stone inspired motifs below are depicting the headline of the 2025 call for decisive action by German meteorologists and physicists: Global Warming is Accelerating (Globale Erwärmung beschleunigt sich).
HHB-GROK (un)hover mouse
Beware of Ideology!
Essential Energy
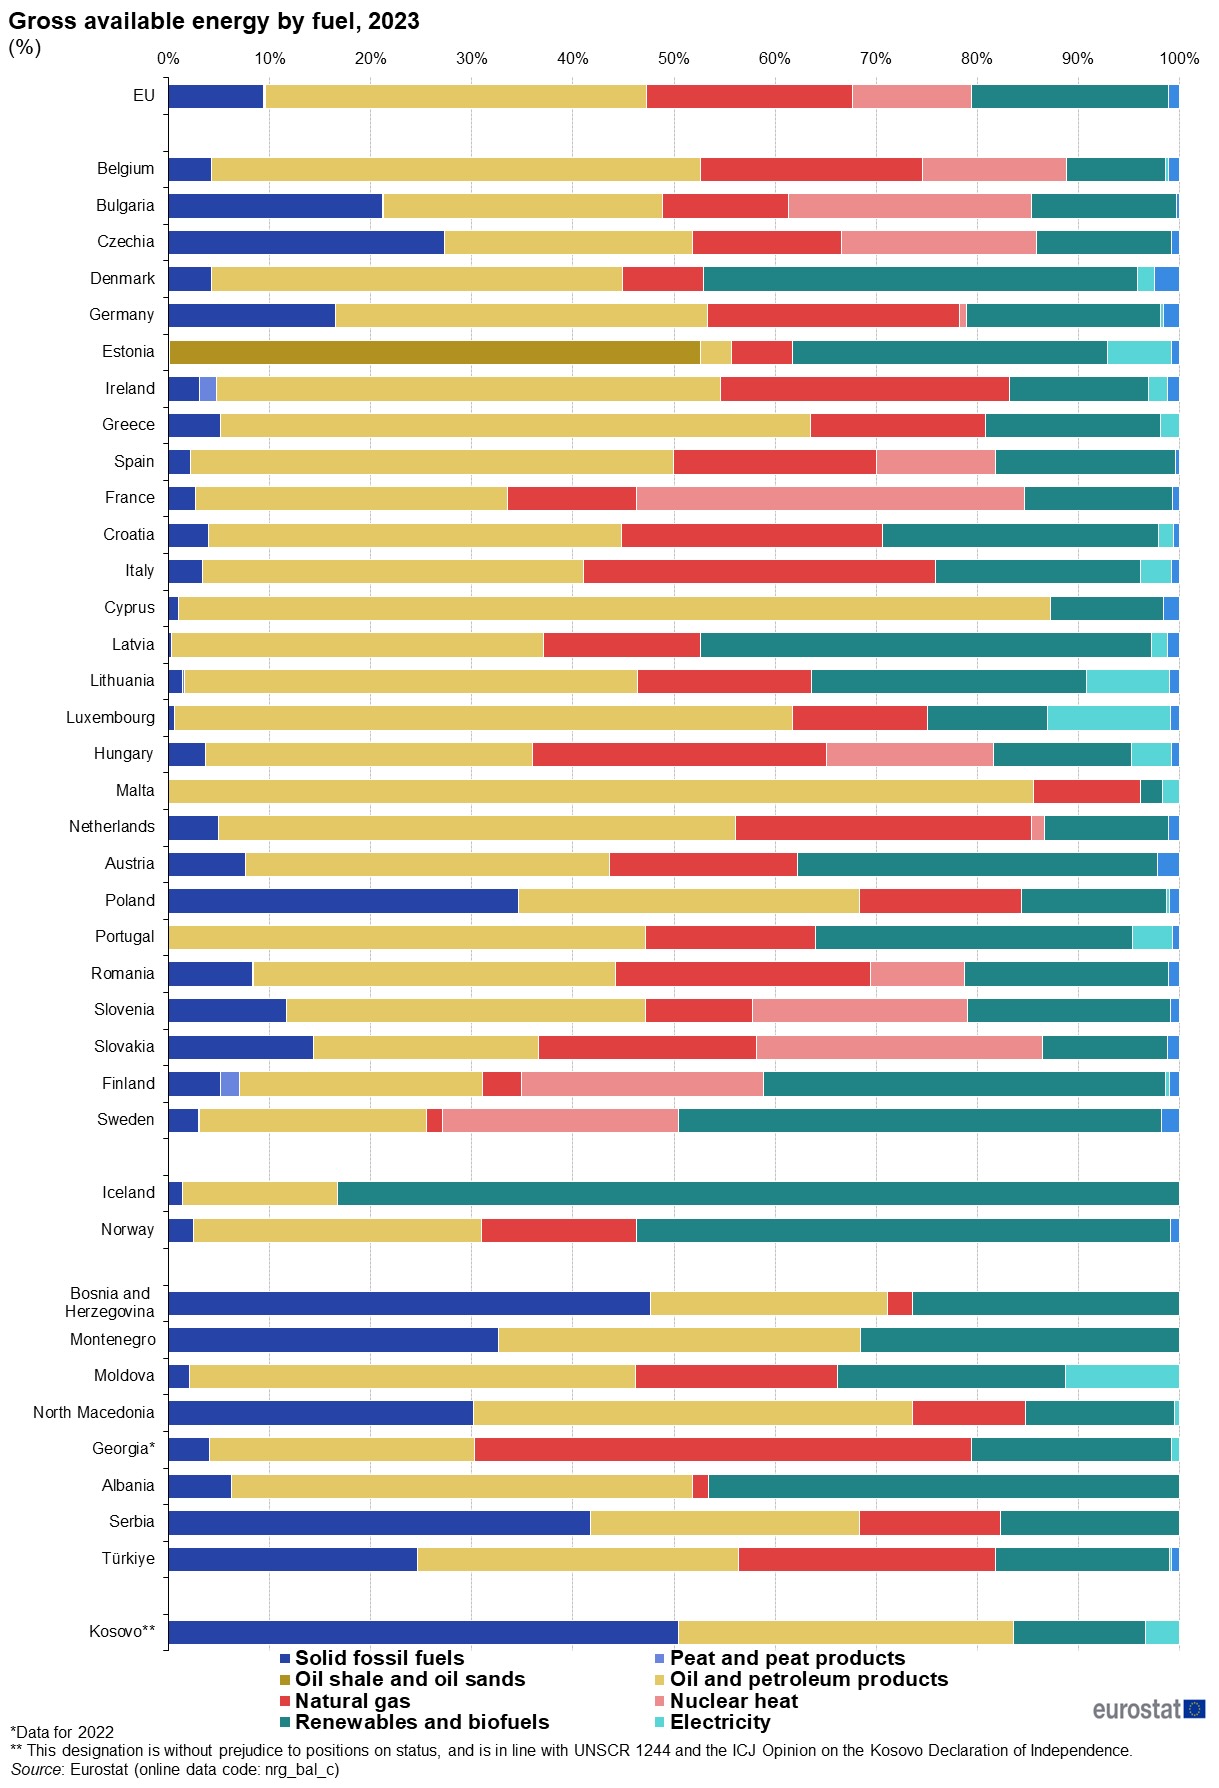
Cheap energy, available in large quantities with little effort, was the driver of progress. In evolution, organisms required nutrient-rich sources to develop powerful brains, which ultimately made humanity's cultural, scientific and technical achievements possible. These, in turn, would have been unthinkable without the exploitation of fossil energy sources. In the EU, fossil fuels accounted for 68% of total available energy in 2023. The conversion of stored chemical energy into mechanical, electrical or thermal energy is necessarily associated with chemical by-products, in case of fossil hydrocarbons usually being carbon dioxide. In addition, the available fossil hydrocarbons on Earth are finite (although still abundant) and after all too precious for burning. Both aspects require a move away from this type of energy conversion. We are looking for solutions that can deliver energy in maximum quantities with minimal impact on the environment.
So far four main approaches have been explored:
- Nuclear energy (fission, fusion)
- Photovoltaics (on Earth, solar powered AI satellites envisioned by Elon Musk)
- Mechanical energy (wind, tides, water)
- Geological energy (thermal, hydrogen)
Going Green and Broke
The obvious solution would be to store excess electricity from bright breezes in order to feed it back into the grid during periods of dark doldrums. Since batteries are not (yet) abundant and affordable enough to cover demands in the order of GWh to TWh, green hydrogen was considered as one part of a solution. This gas can be generated from water electrolysis. Indeed, water electrolysis plants have been installed and further are still projected in Northern Germany, where many wind farms are operated.
At this point it should be noted that green hydrogen has also been proposed as an reactant for chemical syntheses, in particular the production of green steel, biofuels and ammonia. The latter is used as a raw material in chemistry, e.g. fertilizer synthesis (urea, ammonium phosphate). Nevertheless, ammonia was also considered as an easier to handle medium for the shipment of green hydrogen from austral production sites to power plants in boreal countries. However, green hydrogen is meanwhile regarded as a disenchanted beacon of hope. Where it is used it cannot be produced in sufficient quantities and its transportation from the southern hemisphere - even in the form of ammonia - is too costly to render it competitive. Nota bene: economic numbers may be different if exploitation happens locally in regions with high and constant yields of wind and solar power (vide infra, Perspectives).
While water electrolysis is still promoted, German governance pursues the construction of gas-fired power plants as the second part of the solution. In times of wind and PV shortage they shall generate electricity from the burning of methane. This is a German peculiarity, since nuclear scission has been abandoned and the use of coal fueled power plants is phasing out. However, the burning of methane produces CO2 as well. Furthermore, methane has to be imported from distant countries in the form of liquified natural gas in vessels since Germany discontinued the purchase of Russian natural gas through pipelines. Partly, this LNG was obtained through fracking, a practice which is highly restricted in Germany.
How does the current German situation fit in an international comparison? In the figure below some data for different regions are summarized. They show snapshots of electricity generation in 2000 and in 2023 together with the normalized amounts of emitted CO2 that can be assigned to electricity production. The table puts the data from 2023 into perspective with regard to the economic performance of the states (GDP) and their population (nota bene: total emissions means "not restricted to electricity sector"). The share of renewable sources in electricity generation is also indicated. Contrary to all other depicted countries and with the exception of Poland, electricity generation in Europe was overall declining. This is reflecting transitions to more energy efficient industrial processes, energy saving technologies (e.g. LED) and not least overall (de)growth of the diffferrent economies. In most of the shown countries the specific, electricity related CO2 emissions per kWh were reduced by around 30% with lower values for France (23%), Russia (7.6%) and India (3.6%). A larger decrease was realized for the whole EU (42%) which is mainly due to PV installations in the Mediterranian countries and wind farms in the North Sea. For example, Denmark increased the fraction of renewables for electricity production to 81% in 2023 and a reduction of the specific CO2 output to 138 g/kWh (data not shown in the figure). However, the by far lowest emissions per electricity unit are realized in France where a high proportion of nuclear power plants is in operation. The French share of "renewables" is roughly half of the German value and nearly on a par with the Polish.
How do these national differences in electricity generation affect electricity prices? According to an article in Our World in Data by Max Roser (founder of IRENA, International Renewable Energy Agency) "Why did renewables become so cheap so fast?" Germany should have the cheapest and France the highest electricity tariffs in the country selection. Roser was refering to the IRENA report 2020, in which a chart plots electricity prices for diverse production processes as a function of their cumulative installed capacities. In the period from 2010 to 2019 changes were: +62% (nuclear power), −82% (photovoltaic), −29% (offshore wind) and −38% (onshore wind). However, the data are global weighted averages of levelized costs of energy (LCOE) and must not necessarily apply to small countries in moderate altitudes like Europe. Consequently, this data on price trends is not reflected by the actual electricity tariffs for the industrial sector (cf. table below, data without VAT). Prices for households are roughly twice as high in European countries and the USA, and even slightly lower in Asian countries (not shown). It should be noted that the prices given in the table are including network costs (10 to 15% in European countries, 20 to 40% in the other regions), renewable levies and environmental taxes as well as subsidies and cross-subsidies which makes a comparison of generation costs difficult. Anyway, the share of production costs falls in the range of 70 − 80% for the European countries (an average of 75% for the EU). Notwithstanding the lack of comparability, it can be stated that the supposedly cheap, renewable energies (and allegedly expensive nuclear energy) are not reflected in the market prices and that the overall high European values are not competitive on a global scale.
If climate and CO2 emissions were the ultimate criteria for "green" electricity generation, the French practice could be regarded as an indication. Instead, these data are underlining the inconsistent and hypocritical climate ideology of German policies for energy transition. Uncompetitive technologies and resources, respectively, are established without stringently reducing CO2 emissions. Whereas nuclear power plants are diabolized in Germany, "nuclear electricity" from abroad is imported. Fracking is restricted on-site but the gas is welcome if fracking occured elsewhere. Wind farms and electricity in general are subsidized in order to dampen rising energy prizes for those who are paying the subsidies: a shrinking number of tax payers who are less capable to consume goods, leading to weakened profitability of domestic companies and thus rising numbers of dismissed employees, consequently decreasing tax revenues along with rocketing governmental social expenditures, urging states to increase debts and eventually to promote conflicts.
War economy can temporarily mask economic decline and inflation if people are deceived about the true development with social benefits and are sedated by state propaganda broadcast by compliant media. External threads and emergency acts are being used as justification to stifle the few remaining critics. In Europe, in the twenties of the 21st century, the above sketched steps of faltering economies are taking place or are under preparation (armed conflict), further fueled by ideologically misguided migration and the division of the people. Ending the war in Ukraine does not seem to be in the interest of the Eurpaeans. French president Macron called, on Friday, December 5 (2025), to maintain the 'war effort' in favor of Ukraine. From debt crisis over bellicism to destruction, Europe passed the climax and has begun slithering down the curve of a "Big Cycle" (Ray Dalio, How Countries Go Broke: The Big Cycle). Indeed, in a historical context, the current political movements appear to be a déjà vu (Adam Tooze, The Wages of Tyranny. The Making and Breaking of the Nazi Economy).

A Shade of Green
Water electrolysis is not the most efficient process to generate hydrogen. For example, methane splitting processes are needing much less electric energy. Well established is the Kværner process for the pyrolytic degradation of methane in a 1,600°C hot plasma which is generated with electricity. For the same amount of hydrogen − only its colour will be shifted from green to turquoise − it only needs one third to one quarter of the electric energy that is needed with water electrolysis. For catalytic methane splitting this lower amount can even be reduced down to one tenth. The following numbers are refering to the production of 1 kg hydrogen (H2):
- H2O electrolysis: 45 to 80 kWh electricity depending on process
- pyrolytic CH4 splitting: 15 kWh electricity / 55 kWh CH4
- catalytic CH4 splitting: 2 kWh electricity / 72 kWh CH4
With respect to the hydrocarbon, yields can be derived with the lower heat values of CH4 (13.9 kWh/kg) and H2 (33.3 kWh/kg). This translates to 3.96 kg CH4 (250 mol) per kg H2 (500 mol) for the pyrolytic process which equals a quasi 100% yield according to stoichiometry.
Contrary to the burning of methane which produces CO2, the by-product from methane splitting is climate neutral and can be used in industrial applications: carbon allotropes. The pyrolytic process yields graphite-like carbon which could replace mined graphite that is used for the production of anodes in lithium batteries. Catalytic methane splitting yields carbon fibres or carbon nanotubes which are precious raw materials in lightweight composites or building materials. The produced hydrogen could be burned in the power plant instead of methane. Approximately 2 kWh chemical energy is needed for 1 kWh produced electricity and water as the solely chemical product.
In a situation where methane based power plants are erected for the supply of electricity in dark doldrums, a holistic picture taking into account energy balance and material flows seems to be missing in an ideologically dominated society where the shades of green appear to be the most important criterion.

Perspective
Consequently, the so-called "renewable energies" PV and wind which at first hint appear attractive (the sun and the wind won't send bills) should be critically questioned on the following criteria:
- Environment (land use, microclimate, ecology, recyclability)
- Reliability (seasonal, geographical, political implications)
- Costs (energy generation, distribution, net regulation)
- Storage options (losses, costs)
- Negative GHG effect (leaked H2 hampers degradation of atmospheric CH4)
- On economic changes unadapted use of resources
The author sees electrification basing on PV and wind energy - wherever economical and feasible with minimal environmental impact - in conjunction with nuclear energy as the only path to decarbonized yet prosperous societies. The mastery and use of nuclear fusion should be the ultimate goal. Of course, additional forms of energy production such as the use of hydropower or geological energy should be implemented where they make economic sense and are compatible with the environment.
Financial resources and brilliant minds are needed for the realization of nuclear fusion. Unfortunately, too much funding is wasted on progressive projects to transform societies, to subsidize non economic activities (wind energy, hydrogen, "green" steel-making) or to fuel conflicts. Basically people have to pay twofold: with their taxes for subsidies for energy and with their increasing expenses for goods made with noncompetitive processes: a reallocation of wealth bottom up.
Mind your Mind!
In Western societies a trend towards socialist ideals and a departure from meritocracy can be observed. Hedonism and well-being are given greater value than performance. Conformism is expected, contradiction not appreciated if not sanctioned. Distraction in digital worlds and a lack of inspiration are easily compensated for by the use of digital contents prepared on demand by artificial intelligence, which will train itself partially on its own former output. Are we entering a downward spiral from human and artificial intelligence and "workslop", "AI slop" and "shittification" are just heralds of a dystopian world sketched in the movie Idiocracry?
Has humanity passed peak intelligence and is a time window for solving the energy and pollution issues already closing? Are there sufficient people not yet sedated by main stream media propaganda and will there be enough critical, admonishing and demanding voices from those whose processes are depending on cheap and secure energy supplies?
Is human intelligence also threatened by nano- and microparticles that are known to potentially accumulate in our brains? Airborne pollution (break dust, combustion products, tire abrasion) has direct access to the brain via the nose. Plastic degradation particles are omnipresent. They are polluting rivers, oceans as well as land (agriculture) and we are ingesting them with our food and drinking water. Postmortem brain analyses are suggesting a link between microplastic uptake and dementia [1] and a Chinese study reported a positive correlation between plastic exposure and impaired cognitive functions among older Chinese adults [2]. Experiments on mice, fish, crabs and bees revealed behavioral disorders, memory loss, marred decision making and orientation problems as results of even short-term exposure to microplastics.
The study results of Nihart et al. [1] on particles in human brains have received some public attention, as popular science media have referred to them with a "terrifying" transcription: having the mass equivalent of a plastic spoon (7 g, see also bottom center figure) in our brains is not a pleasant idea, not even for the author of this page. Therefore, I had a closer inspection of the article and made a plausibility check (click toggle beneath the text for details). The conclusion can be summarized by the following four statements:
- No information is available whether the reported data from frontal cortex samples are representative for the whole brain.
- In the supplementary information of the article (see [1], the results were plotted with a tenfold lower concentrations of plastic material.
- Even taking one magnitude lower plastic concentration in brain tissues, the particles could not be ingested as such. Based on literature data for estimated annual uptake of plastic particles ([3], [4], [5]) it would take up to billions of years for their accumulation.
- A realistic scenario that is in accordance with literature data ([8], [9]) would be the ingestion of larger particles which disintegrate into those submicron sized fragments found in brain tissues, regardless of the concentrations reported in the article or the supplementary information, respectively.


Like climate, the accumulation of microplastic particles in brains (and other fat-rich tissues) is a serious concern: the calamitous effect on the performance of animal brains and the possible connection with dementia in human brains. Although the causality for the latter is still unclear (dementia is known to go along with an impaired blood brain barrier), a plausible explanation for a possible trigger mechanism should be investigated: Microplastic particles might act in the brain as a lithium sink in analogy to amyloid-ß plaques which were recently found to sequester lithium ions and thus trigger the onset of Alzheimer's disease [6].
However, this brief analysis of a presumably sound scientific work contrasts the way how one key result of the study was uncritically exploited by numerous main stream media These have transcribed one (questionable) number into an fear-mongering image. A fundamentally correct and worrying finding is presented in a dramatized manner. The proximity in time to the then upcoming UN conference on plastic waste containment in Geneva may be a coincidence. Anyway, this appears as commonality with the climate discussion.
[1] Nihart et al., Nature Medicine 31 (2025) 1114 and Supplementary Information
[2] Zhu et al., J. Alzheimer's Disease 101 (2024) 1015
[3] Cox et al., Environmental Science & Technology 57 (2021) 5630
[4] Li et al., Science of the Total Environment 946 (2024) 174215
[5] Allen et al., Nature Communications 12 (2021) 7242
[6] Aron et al., Nature 645 (2025) 712
[7] Kopatz et al., Nanomaterials 13 (2023) 1404
[8] Cetin et al., Environmental Chemistry Letters 21 (2023) 639
[9] Henry et al., Polymer 202 (2020) 122589
Closing the Loop.

The degradation of plastics is a result of mechanical stress and the chemical breakdown of polymer chains via hydrolysis or as a consequence of absorbed UV radiation. Depending on the plastics composition (polymers, pigments, additives), the polymers' chemical nature and the environmental conditions the degradation may take decennials or even centuries. That longevity of plastic pollution until the degraded particle sizes are reaching the μm and nm range, in combination with the increasing plastic production, let the accumulation of particles in brains (vide supra: mind your mind) appear like a time bomb.
What does climate have to do with it? Beyond CO2 emissions in the plastics production (global warming) climate has an impact on plastics degradation, at least theoretically: higher temperature accelerates chemical reactions (Arrhenius law) and acidifying water speeds up hydrolysis (protonic catalysis). More dramatic weather (storms, floods) is mobilizing and distributing garbage from landfills and urban areas.
Humanity and civilization will not go extinct in a rapidly heating world - the scenario drawn by climate apocalyptics. Rather, people will become mentally degenerate and slowly perish from their inability to recognize and solve problems. Similar to what you see in the movie Idiocracy. Somehow, this reminds me of the dark visions of Zdzisław Beksiński, e.g. his painting Creeping Death (vide infra). Possibly, there will be a rapid extinction halfway (or sooner than later) as a result of a nuclear conflict.
With regard to science the loop closes with a citation from the authors who wrote about the impact of climate on plastics pollution [1]:
"While comparability of methods is critical, and rigorous examination of the science being published is critical in all fields of research, it is of particular importance in this complex and evolving field because policy around plastic pollution is being developed in tandem."
[1] Figure 1 from Kelly et al., Front Sci (2025) 3:1636665. Plastic pollution under the influence of climate change: implications for the abundance, distribution, and hazards in terrestrial and aquatic ecosystems.
GROK animated section out of "creeping death" (Pełzająca śmierć) from Zdzisław Beksiński (1973)
Video will also pause on outside click.